| Home Precipitation River Discharge Sea Level Air Temperature Water Temperature Cloudiness Wind Download Data |
Introduction
Global-scale averages of observations of surface temperature in the atmosphere
over both land and ocean exhibit a warming trend over the last century (Hansen et al., 1996; 2010) .
However, detecting changes in coastal water temperatures at the scale of
estuaries has frequently been confounded by the absence of sufficiently long
data records and the presence of high amplitude variations at short time (days
to years) and space ( Over the last three decades, the high population density and
long history of exploitation of fisheries in the estuaries of southern New
England have led to the development and implementation of management
regulations to improve water quality and restore fisheries populations. The
harvest of American Lobster in Long Island Sound, for example, has declined
substantially since 1991 (Howell et al., 2005) and it has been proposed by Camacho et al. (2006) that this is partially
a consequence of physiological temperature stress that has been enhanced by
warming bottom waters. Clearly, separating the effect of environmental change
from that of fishing and other predation is critical to the regulation of the
fishery.Temperature clearly affects other species as well (e.g., Atlantic Croaker (Hare and
Able, 2007); brown algae (Keser et al., 2003); non-native species such as Sea Squirts (Stachowicz et al., 2002)). Recently,
Howell and Auster (2012) reported an analysis of the character of fish species
distributions in Long Island Sound based on a long time series of trawl
surveys. They showed that there has been an increase in the number of species
that are more commonly observed to the south of the Sound (warm water adapted)
and a coincident reduction in the number of species characteristic of
communities to the north (cold water adapted). This shift correlated with
temperature change. Understanding whether this is a shift, or part of a long
term cycle is a critically important question for the choice and effectiveness
of management approach. Temperature is the best observed characteristic of coastal environments. Available observations were assembled to examine the characteristic of their variability in order to discern magnitude of the local consequences of global changes.
Previous Studies
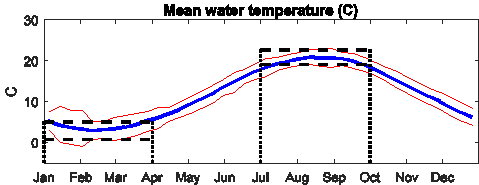
Previous studies have shown that temperature in LIS is mainly dominated by seasonal variation
with the minimum temperature occurring in February and the maximum in
September. The annual range of the minimum and maximum temperature is higher in
the western Sound (~0.7o to 22.6 oC) than in the eastern
part (1.0o–20.5oC).
The depth-averaged temperature
contains larger inter-annual variability in winter than in summer. The
magnitude and the timing of the inter-annual variations of temperature
in
eastern LIS do not appear to be correlated with those in the western
LIS. For
example, negative anomalies from the summer of 1992 to early 1994 seen
at
station F3 are larger than at station M3, and strong negative anomalies
at
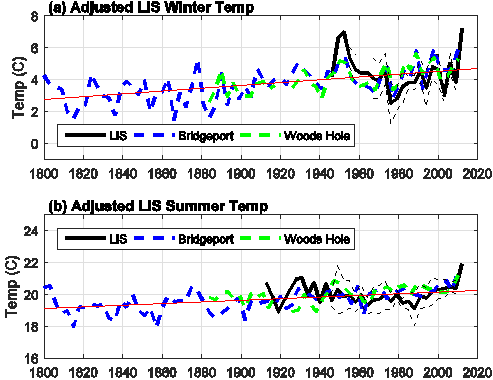
station M3 in the winter of 1996 are hardly noticeable at station F3. Long-term changes in surface temperature in LIS differ
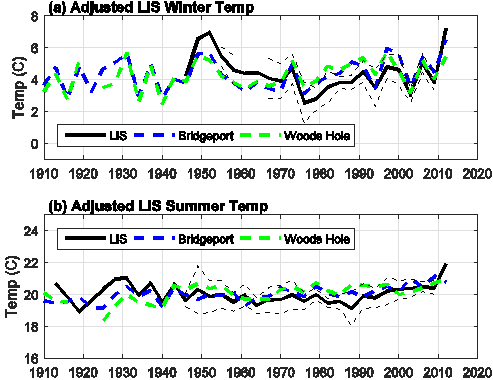
markedly between winter and summer. While winter temperatures have been shown
to increase, the change for summer has been almost negligible (Lee and Lwiza,
2008). Wilson et al. (2008) reported that the increase in thermal
stratification in the western LIS during summer months (July and August) from
~0.5o to 2 oC between 1946 and 2006 was mainly due to the
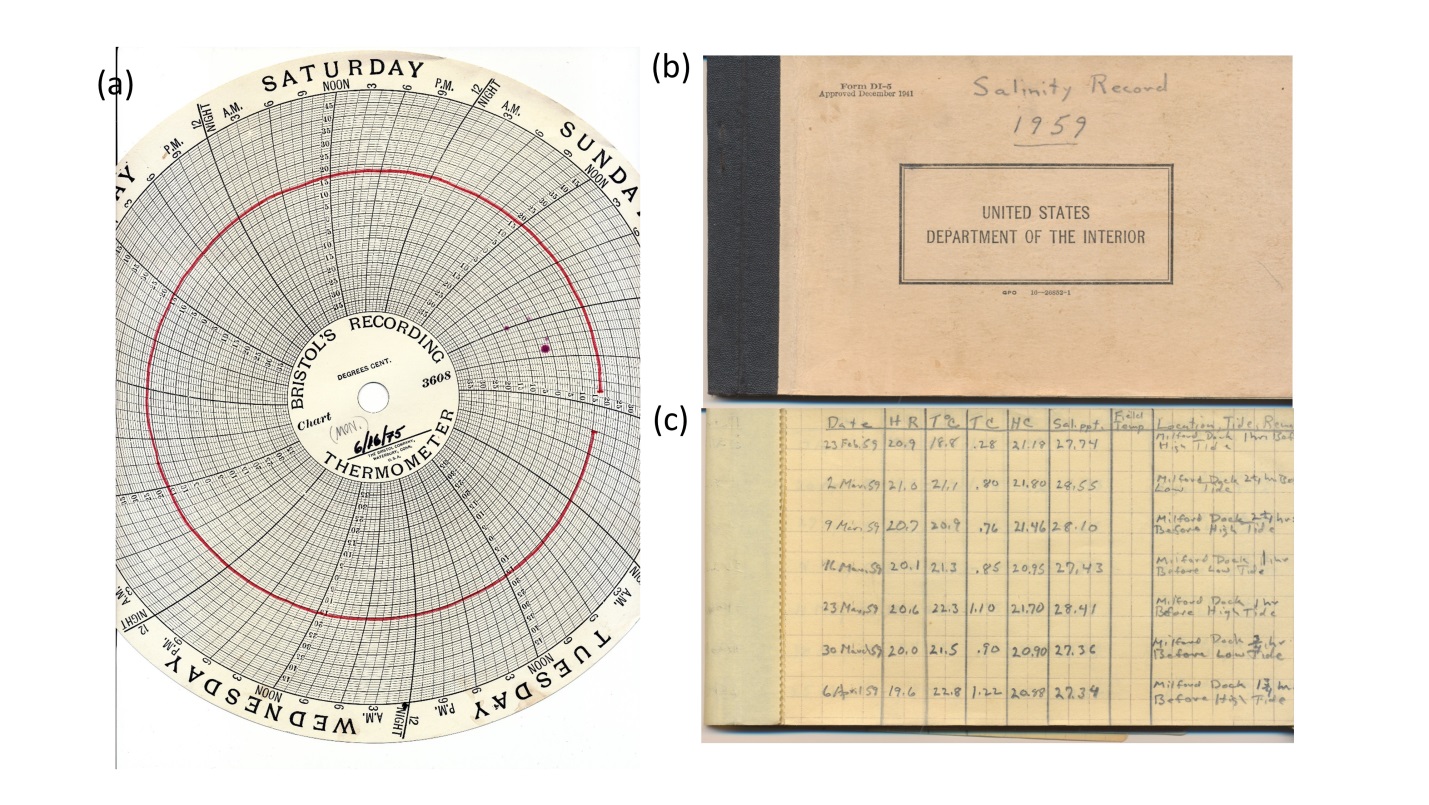
decrease in bottom. In this study, previously unpublished archived
temperature data are aggregated with more accessible observations and statistically derived
temperature correlates to more completely describe the long term trends and
variability in coastal water temperatures so that significance of the more
recent, and well documented, changes can be placed in a broader climate
context. Data
Sources
Summary
and Conclusions
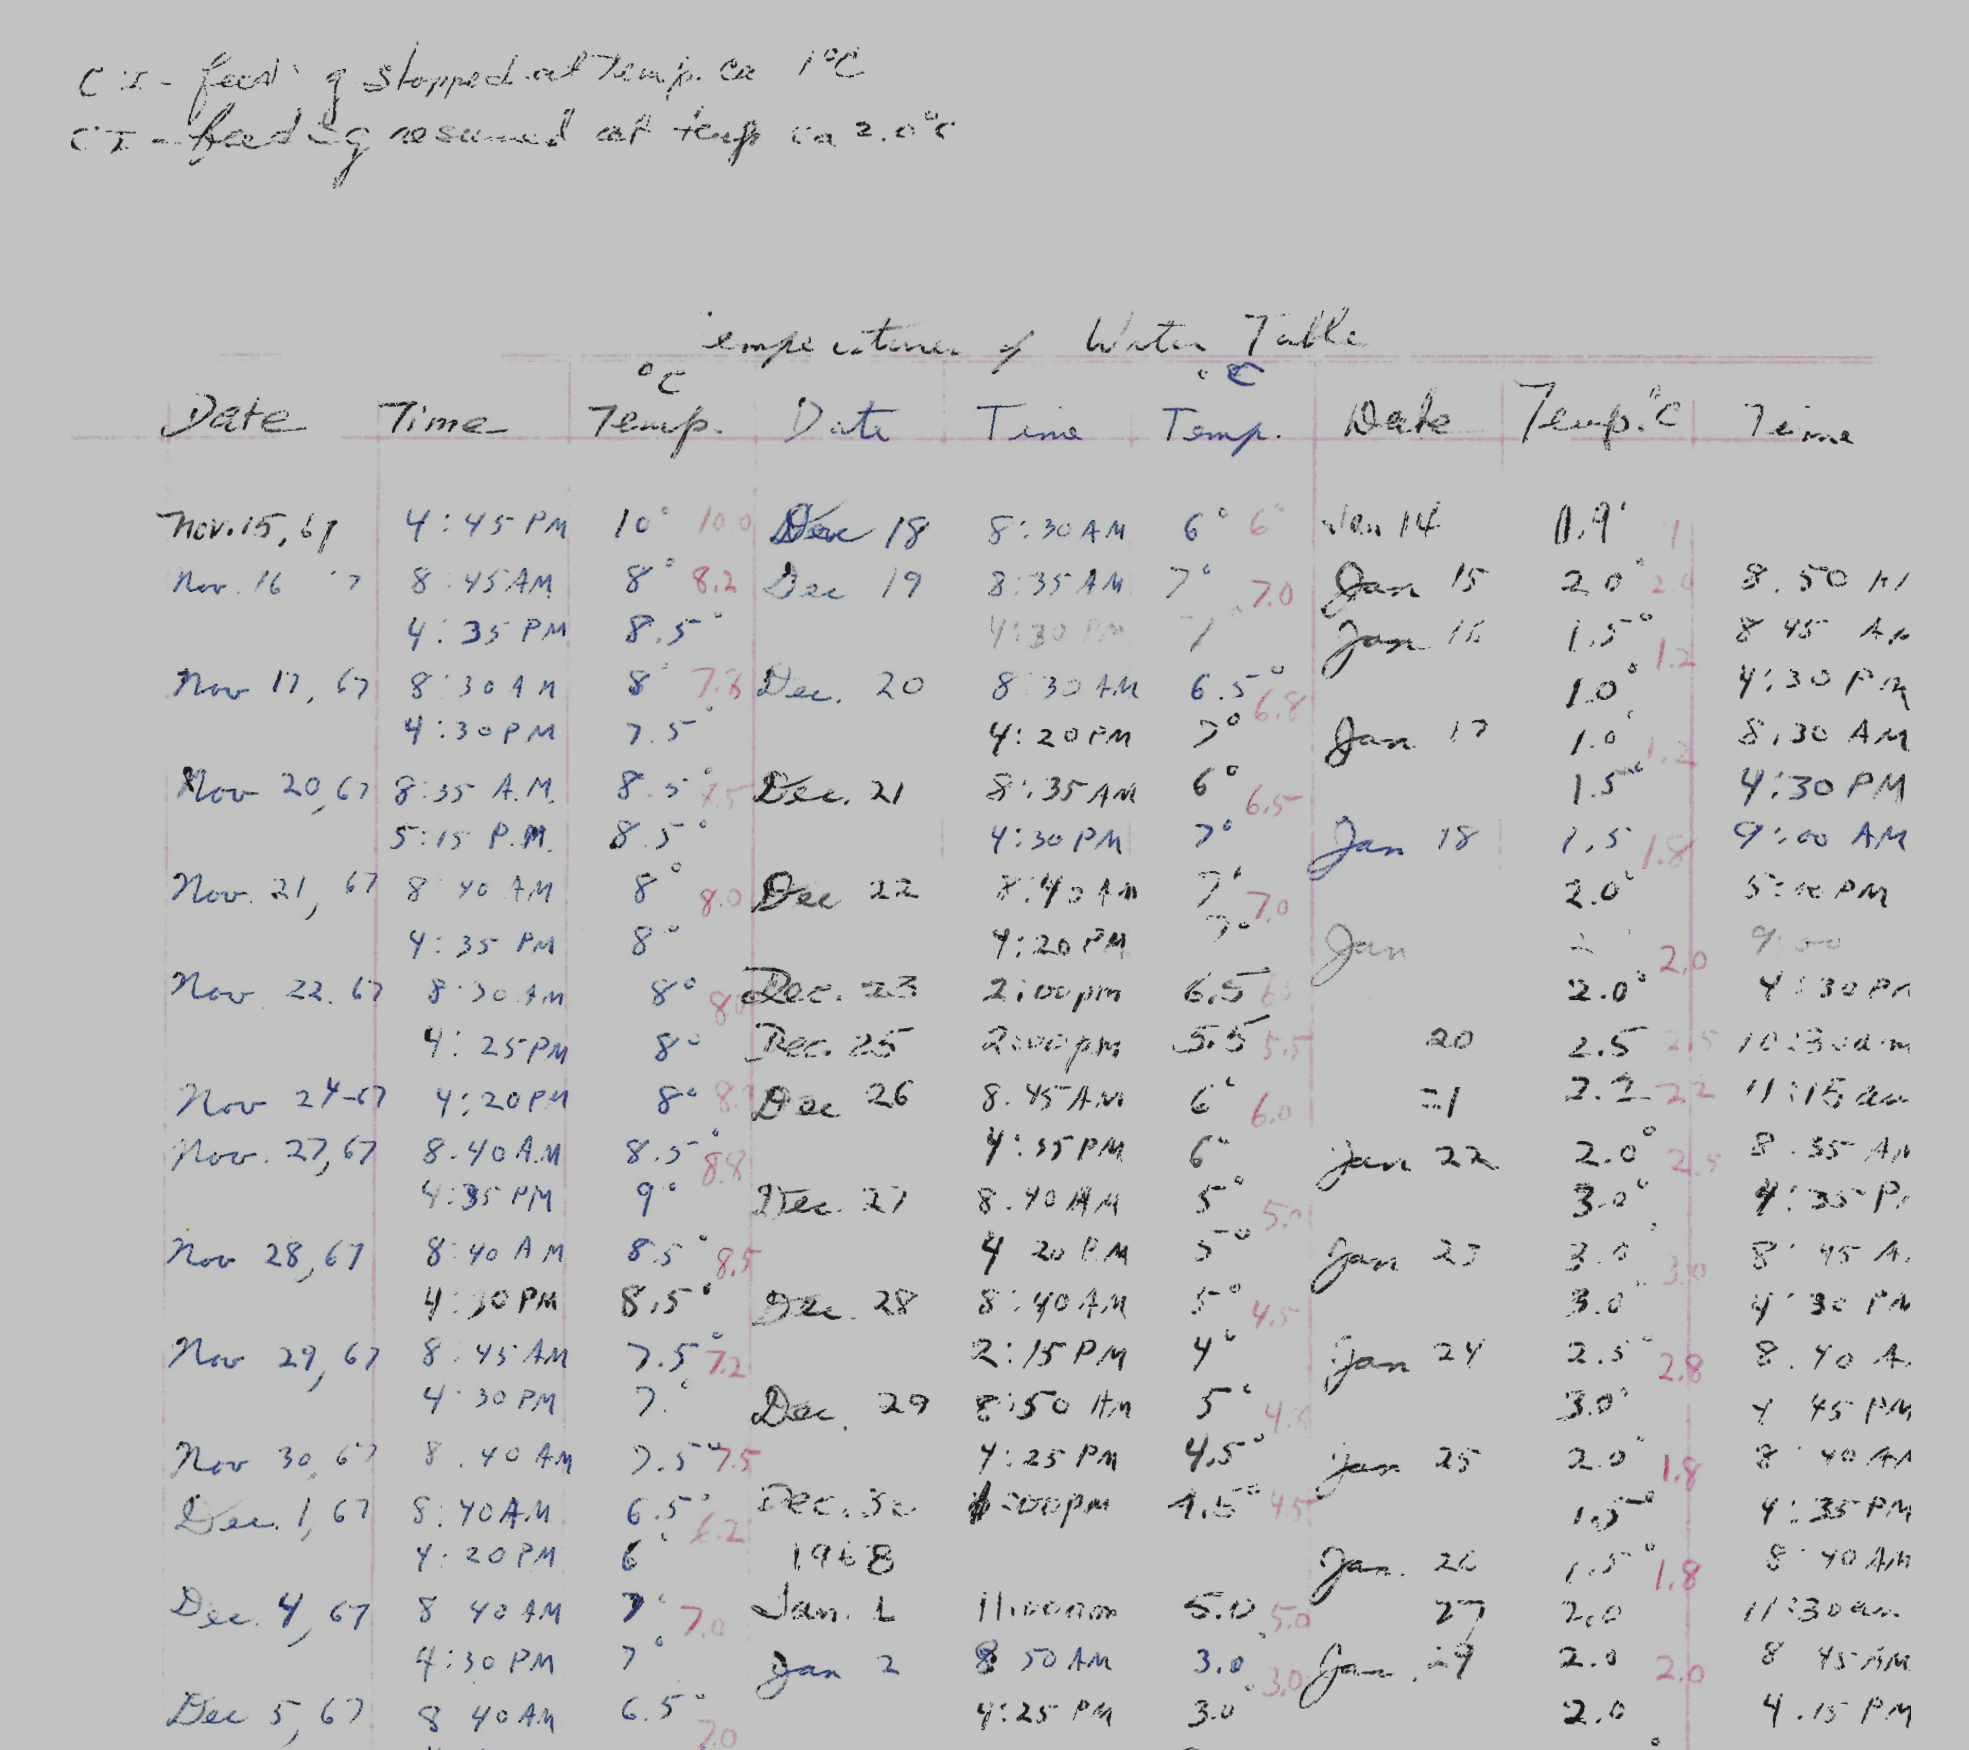
We have assembled and quality checked a large and diverse
array of observations of temperature in Long Island Sound. We have included the
data from the both the eastern and western extremities of the estuary. Our
analysis of the seasonal cycle at the Millstone Power Plant record showed that
the rate of change of temperature was smallest in January-March and July to
September, so we chose these times to examine longer term trends since they
would be less prone to bias by irregular sampling.
Four records were assembled for the winter and five for the summer. An index of the summer and winter temperatures was created by computing the mean difference between contemporaneous segments of the observation records. Three empirical constants were used in the summer and four in the winter. The data were then bin averaged in three year intervals to create records that span 1930 to 2012 in the winter and 1915 to 2012 in the summer.
The aggregated data series, a LIS temperature index, showed that water temperatures in the interval 1960-2010 were anomalously cool in both the winter and the summer, whereas the winters between 1945 and 1955 were anomalously warm. Since 1965 temperatures in both the summer and the winter have been rising. The summer and winter of 2012 were both anomalously warm.
ReferencesBumpus, D. F.
(1957). Surface water temperatures along Atlantic and Gulf Coasts of the United
States. Special Scientific Report Fisheries No. 214. U.S. Department of the Interior,
Fish and Wildlife, Washington, D.C. Camacho, J.,
S. A. Qadri, H. Wang and M. K. Worden (2006), Temperature acclimation alters
cardiac performance in the lobster Homarus americanus. J Comp Physiol A.
DOI 10.1007/s00359-006-0162-1 Gay, P. S.,
J. O’Donnell, and C. A. Edwards (2004), Exchange between Long Island Sound and
adjacent waters, J. Geophys. Res., 109, C06017, doi:10.1029/2004JC002319. Hansen, J.,
R. Ruedy, Mki. Sato, and R. Reynolds (1996) Global surface air temperature in
1995: Return to pre-Pinatubo level. Geophys. Res. Lett., 23,
1665-1668, doi:10.1029/96GL01040. Hansen, J.,
R. Ruedy. M. Sato and K.Lo (2010). Global surface temperature change. Reviews
of Geophysics. Rev. Geophys., 48, RG4004, doi:10.1029/2010RG000345. Hao, Y. (2008) Tidal
and residual circulation in Long Island Sound. Ph.D. Dissertation, Marine
Sciences Research Center, Stony Brook University, Stony Brook, NY, 70 pp. Hare, J. A.
and Able, K. W. (2007) Mechanistic links between climate and fisheries along
the east coast of the United States: explaining population outbursts of
Atlantic croaker (Micropogonias undulatus). Fisheries Oceanography,
16: 31–45. doi: 10.1111/j.1365-2419.2006.00407.x Howell, P., J. Benway, C. Giannini, K. McKown, 2005. Long-term
population trends in American lobster (Homarus americanus) and their relation
to temperature in Long Island Sound. Journal of Shellfish Research
24(3):849-857. doi: 10.2983/0730-8000(2005)24[849:LPTIAL]2.0.CO;2 Howell, P. and P.J. Auster (2012) Regime shift in the
finfish community of a Northwest Atlantic estuary associated with changes in
thermal regime. Coastal and Marine Fisheries: Dynamics, Management, and
Ecosystem Science 4:481-495 Kaputa NP and
Olsen CB (2000) State of Connecticut Department of Environmental Protection,
Long Island Sound Ambient Water Quality Monitoring Program: Summer Hypoxia
Monitoring Survey '91-'98 Data Review. CTDEEP, Water Management Bureau, 79 Elm
St, Hartford, CT 06106. 45 pp. Keser, M., J.
T. Swenarton, J. M. Vozarick, and J . F. Foertch. (2003). Decline in eelgrass
(Zostera marina L.) in Long Island Sound near Millstone Point, Connecticut
(USA) unrelated to thermal input. Journal of Sea Research 49:11-26. Lee, Y.J., (2009). Mechanisms
Controlling Variability in Long Island Sound. Ph.D. thesis, School of Marine
and Atmospheric Sciences, Stony Brook University, New York. Lee, Y.J.
and K.M.M. Lwiza. (2008). Characteristics of bottom dissolved oxygen in Long
Island Sound, New York, Estuar.Coast. Shelf Sci., 76:187-200.
doi:10.1016/j.ecss.2007.07.001 McCardell,
G.M. and J. O’Donnell (2009) A novel method for estimating vertical eddy
diffusivities using diurnal signals with application to Western Long Island Sound.
J. Mar. Systems. 77 (2009) 397–408 Nixon S.W., S.
Granger, B. A. Buckley, M. Lamont, and B. Rowell (2004). A one hundred and
seventeen year coastal water temperature record from Woods Hole, Massachusetts.
Estuaries 27: 397–404. O'Donnell,
J., R. E. Wilson, K. Lwiza, M. Whitney, W. F. Bohlen, D. Codiga, T. Fake, D.
Fribance, M. Bowman, and J. Varekamp (2014) The Physical Oceanography of Long
Island Sound. In Long Island Sound: Prospects for the Urban Sea. Latimer, J.S.,
Tedesco, M., Swanson, R.L., Yarish, C., Stacey, P., Garza, C. (Eds.), ISBN-13:
978-1461461258 Riley, G. A.
(1952), Hydrography of the Long Island and Block Island Sounds, Bull. Bingham
Oceanogr. Collect., 13, article 3. Riley, G. A.
(1956) Oceanography of Long Island Sound: 1952-1954. II. Physical Oceanography
Bulletin of the Bingham Oceanographic Collection, V.15, Peabody Museum of
Natural History, Yale University, New
Haven, Connecticut, USA Rohde, R., R.
A. Muller, R. Jacobsen, S. Perlmutter, A. Rosenfeld, J. Wurtele, J. Curry, C. Wickham,
and S. Mosher, (2013) Berkeley Earth Temperature Averaging Process. Geoinfor
Geostat: An Overview 1:2. doi:10.4172/gigs.1000103 Stachowicz,
J. J., J. R. Terwin, R. B. Whitlatch, R. W. Osman (2002) Linking climate change
and biological invasions: Ocean warming facilitates nonindigenous species
invasions. Proc. Natl. Acad. Sci. U.S.A. 99, 15497 Wilson, R. E., R. L. Swanson, and H. A. Crowley (2008), Perspectives on long-term variations in hypoxic conditions in western Long Island Sound, J. Geophys. Res., 113, C12011, doi:10.1029/2007JC004693.
|
|||||||||||||||||||||||||||||||||||||||||||||||||||||||||||||||||||||||||||