
| Home Precipitation River Discharge Sea Level Air Temperature Water Temperature Cloudiness Wind Download Data |
Introduction
|
Precipitation ObservationsMeasurements of precipitation are archived at NODC and can be accessed through the “Climate Data Online” web site. Figure 1 shows the locations relative to the shoreline of the Sound |
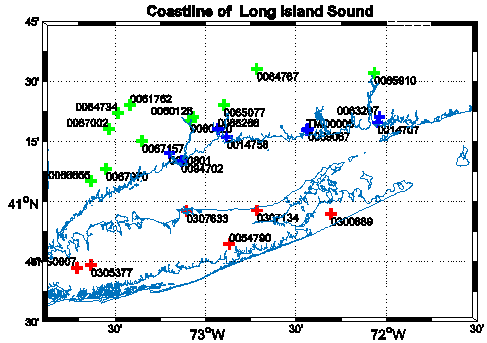 Figure 1. Site map of meteorological stations. Upland CT stations are green, coastal CT stations are blue, and LI stations are red. |
Trend and Variability AnalysisFigure 2
shows the mean and |
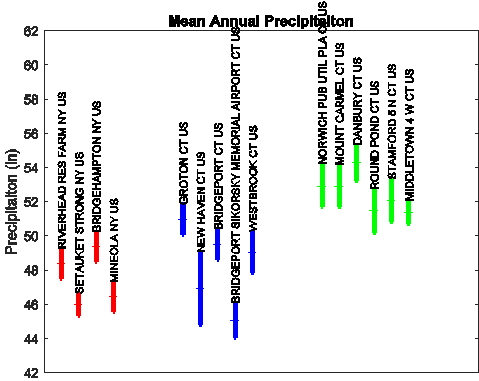 Figure 2. Comparison of long term mean annual precipitation. The red symbols show the statistics for the stations on Long Island while the blue and green show the data for coastal and upland Connecticut, respectively. |
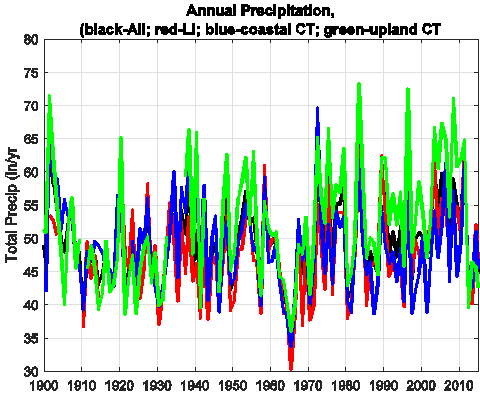 Figure 3. Average by year of all annual precipitation estimates across the three geographic areas. |
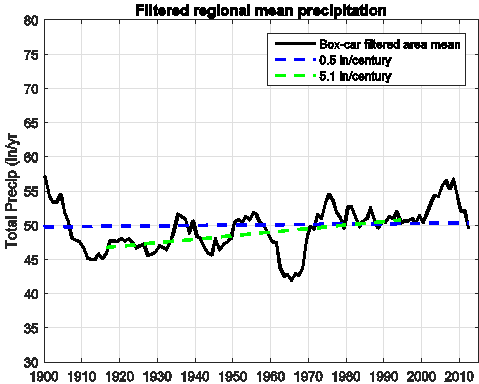 Figure 4. Regional mean precipitation filtered with a box-car moving average (black line) and long term trend estimated using un-weighted linear regression and all the data (blue dashed line). The slope shows an increase of 0.5 inches per century. The green dashed line also shows a regression based on data between 1915 and 1994. The rate of increase is more rapid at 5.1 inches per century. |
|
The differences between the trends in the three sub-regions
are computed by subtracting the mean of all the stations (Figure 4)
from the mean of each of the other three series. Figure 5
shows the results after a 7-year running-mean filter has been applied to each
series. The green line shows that the annual precipitation anomaly in the
inland areas since 1935 is generally higher than the others in keeping with the
results in Figure 2.
The coastal Connecticut stations (blue) and Long Island Stations (red) show a
generally decreasing trend. The decadal-scale variability in the upland CT
(green line) is negatively correlated with the variations on Long Island and of
approximately equal magnitude (about 5 inches). A significant peak in the cross
correlation of these series occurs at zero lag with a magnitude of -0.5. This
is consistent with the conclusion that the regional mean is not changing very
much but the Long Island and coastal area have experienced a reduction in the
annual precipitation while the inland areas have experienced a slight increase. |
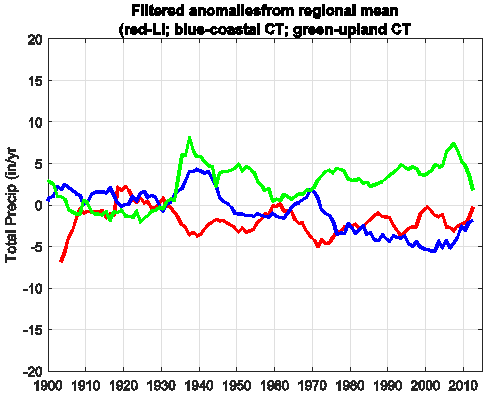 Figure 5. Difference between the box-car filtered average precipitation across the entire region and the filtered average in the three sub-areas. |
|
Figure 6
displays the variation in the number of days on which greater than zero
rainfall and snow were reported. The analysis reveals that in most
years it rains approximately 10 fewer days on Long Island (mean of 100 days) than
in coastal Connecticut (120 days). The area wide mean over the whole record,
and in inland Connecticut, is 115 days with a standard deviation of 13 days. Coastal
Connecticut endured more rain days in the period 1925-35 but there was a
decline until 1960 and since then the variation has been less. Long Island also
endures fewer days of snow (11) than Connecticut (14) in most years. However, the
number of snow days has been declining throughout the 20th century
across the region. This is particularly apparent on Long Island where the mean
of the last 30 years shows 3 days less snow than the earlier period. |
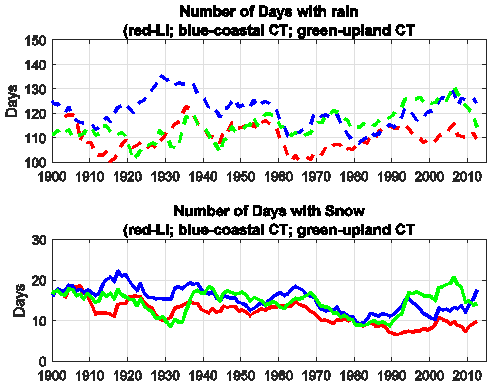 Figure 6. a) Evolution of the average across the three region of the number of days in which rain was measured. A seven year box-car filter has been applied to the records. b) Corresponding data for snowfall. The red lines show the Long Island station data and the blue and green show the coastal and inland Connecticut stations. |
|
Figure 7 shows
how the fraction of observations greater than 2 inches per year varies with time.
The percentage of observations in each sub area is plotted using the same color
code and added to the other sub areas. Note that 5 year intervals were used to
stabilize the estimates but the percentage of observations per year is
presented. The distribution in the three areas is highly correlated and of
comparable magnitude. There appears to have been a large increase in the
occurrence of high rainfall days after 1940 and then a dip in the mid-1960s.
Between 1975 and 2000, the frequency of high precipitation reached a maximum
and then declined. This is not completely inconsistent with the analysis of
DeGaetano (2009). His conclusion applies to a much larger region and based on
extreme value statistics using only data before 2007. Our results show no evidence
of an increase in extreme precipitation events in the coastal areas surrounding
Long Island Sound. |
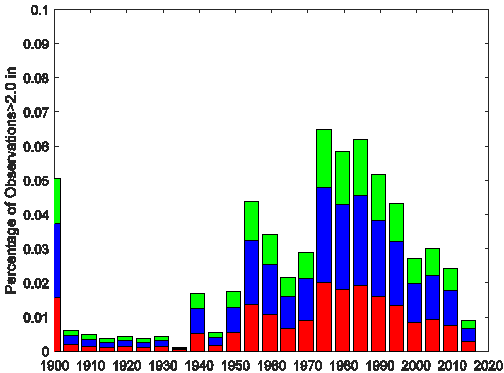 Figure 7. Percentage of all observations in excess of 2 inches per
day in 0.25 in bins. Red shows Long Island, and blue and green show coastal and
inland Connecticut. |
We have identified a subset of the NODC weather observation stations that span the area surrounding Long Island Sound and evaluated the data quality for the estimation of Total Precipitation (rain and snow). The station data was analyzed to discriminate differences from coastal Connecticut, inland Connecticut and Long Island. We find that the mean annual precipitation at the inland stations is significantly higher than in the coastal areas and Long Island. The records show substantial year to year variability but that the area-wide average precipitation does not show a significant long term trend. There is, however, long term trends within the region with the annual precipitation in the coastal regions negatively correlated at decadal scales with those inland. The inland stations also show an increasing trend. The number of days of rain and snow were also examined and we show that there has been a slight decline in the number of snow days on Long Island over the last century. The number of days with rainfall exhibits decadal scale cycles but has not appreciable changed on Long Island or inland Connecticut, although there is evidence of fewer rain days in coastal Connecticut in the recent past relative to the 1930s. Finally, we examined the frequency of occurrence of rainfall events leading to more than 2 inches of rain in a day. We find no evidence of an increasing trend the in the frequency of these events.
DeGaetano,
A.T. (2009). Time-Dependent Changes in Extreme Precipitation Return-Period
Amounts in the Continental United States. Journal of Applied Meteorology &
Climatology, vol. 48, no. 10, pp. 2086–2099.
Horton, R.,
G. Yohe, W. Easterling, R. Kates, M. Ruth, E. Sussman, A. Whelchel, D. Wolfe,
and F. Lipschultz (2014) Ch. 16: Northeast Climate Change Impacts in the United
States: The Third National Climate Assessment, J. M. Melillo, Terese (T.C.)
Richmond, and G. W. Yohe, Eds., U.S. Global Change Research Program, 16-1-nn.
Knutson,
Thomas R., F. Zeng, and A. T. Wittenberg (2014) Seasonal and Annual Mean Precipitation
Extremes Occurring During 2013: A U.S. Focused Analysis [in "Explaining
Extremes of 2013 from a Climate Perspective"]. Bulletin of the American
Meteorological Society, 95(9), S19-S23.
Miller, D. G.
S. Warner, F. L. Ogden and A.T. DeGaetano (2002) Precipitation in Connecticut.
CT. Inst. Water Resources, Special Report. (Available at
http://www.ctiwr.uconn.edu/PrecipinCT/precip.pdf).
U.S. Global
Change Research Program (USGCRP) (2009) Global Climate Change Impacts in the
United States, Thomas R. Karl, Jerry M. Melillo, and Thomas C. Peterson, Eds. Cambridge
University Press.
Walsh, J., D.
Wuebbles, K. Hayhoe, J. Kossin, K. Kunkel, G. Stephens, P. Thorne, R. Vose, M.
Wehner, J. Willis, D. Anderson, S. Doney, R. Feely, P. Hennon, V. Kharin, T.
Knutson, F. Landerer, T. Lenton, J. Kennedy, and R. Somerville (2014) Ch. 2: Our Changing Climate. Climate
Change Impacts in the United States: The Third National Climate Assessment, J.
M. Melillo, Terese (T.C.) Richmond, and G. W. Yohe, Eds., U.S. Global Change
Research Program, 19-67. doi:10.7930/J0KW5CXT.