
| Home Precipitation River Discharge Sea Level Air Temperature Water Temperature Cloudiness Wind Download Data |
Introduction
|
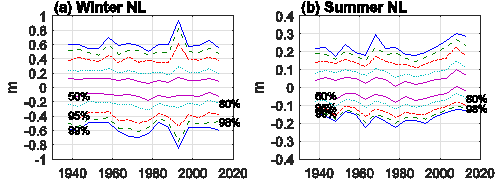 |
(a) shows the distribution of the de-trended December to February (DJF) water level anomalies at New London in five year time-bins. The blue lines bound the water level range containing 99% of the observations. The green, red, cyan and magenta lines contain the 98%, 95%, 80% and 50% of the observations, respectively. (b) shows the same statistics for the June-August interval. Note the change of scale. |
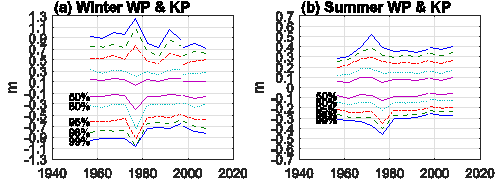 |
a) shows the distribution of the de-trended December to February (DJF) water level anomalies at Willets-Kings Point computed in the same manner as in the figure above. (b) shows the same statistics for the June-August interval |
Since the effects of wind on sea level in the winter are so
large in the western Sound, the impact of sea level rise is not very
significant. In the summer and in the eastern Sound, the impact is large and
clearly observable in the anomaly data distributions. The examples of the
impacts on the change in the frequency of flooding that the mean sea level
change has caused are quite significant. The significance scales with the ratio
of the magnitude of the change in mean level to the standard deviation in the
wind driven anomalies. When the distribution is narrow, a small change in the
mean level can lead to a large change the frequency of flooding. We show the
empirical frequency distribution is narrow in the summer and in the eastern
Sound. Coastal ecosystems that are sensitive, either positively or negatively,
to changes in flooding frequency will be most impacted in the eastern Sound.
.
Garvine, R.W.
(1985). A simple model of estuarine subtidal fluctuations forced by local and
remote wind stress. J. Geophys. Res., 90(C6), 11,945–11,948.
Foreman, M. (1980).
The harmonic analysis of tidal model time series. Adv. Water Resources. 12.
109-120.
O'Donnell,
J. and J.E.D. O'Donnell (2012). Coastal Vulnerability in Long Island Sound: The
Spatial Structure of Extreme Sea Level Statistics. Oceans, 2012, pp.1-4, 14-19
Oct. 2012.
Wong, K. -C.,
(1990). Sea level variability in Long Island Sound. Estuaries, 13, 362-372.