Home
Precipitation
River Discharge
Sea Level
Air Temperature
Water Temperature
Cloudiness
Wind
Download Data
|
The adaptive management of the
resources of Long Island Sound (LIS) requires on-going observations to
characterize the variability and change of the environment and ecosystem it
supports. It is critical that changes that result from local human activities
(and can potentially be regulated) be separated from those that are a
consequence of natural cycles and global scale processes. Therefore, it is
important to examine existing measurements from Long Island Sound and its
watershed to determine whether changes that have been observed at the global
scale have discernible and important impacts in the region.
| The detection of climate change
signatures in observations is a very challenging task. The aggregation of
temperature measurements from around the world, together with an extensive and
sophisticated program of data quality checking, bias corrections, and weighting
to correct for heterogeneous sampling density, was central to the development
of the first broadly accepted evidence of global warming. The products of these
programs have become known as the NASA-GISS (Hansen et al., 1999), the
NOAA-NCDC (Reynolds and Smith, 1994) and the Hadley-CRU (Jones et al., 1999)
temperature climatologies. Since the implications of global warming are vast,
and the costs of mitigating the effects of change are huge, the results of
these analyses have been challenged repeatedly in the literature and in the public press. |
| Among the more reasonable objections were that the data and
analysis methods were not independent, the groups shared ideas during the development process, and that the data analyses procedures were not
transparent. These criticisms have motivated an entirely new analysis by the
Berkley Earth group.
They repeated the process of data aggregation, screening, etc., and developed
an open source approach to sharing data and analysis software. They recently
released preliminary results and have submitted their reports for publication
(Rohde et al., 2011). The figure
shows a comparison of the decadal average of the global average of land
observations for the three earlier analyses and that of the Berkley Earth
group. The grey shaded areas are the 95% confidence interval of the Berkley
Earth analysis (black line). All four trends are in close agreement since 1950
when instruments and data standards improved. Between 1900 and 1950, the
Berkley Earth results are slightly lower than the others. Overall, the case for
warming by 1.3ºC since 1900 is strong. The project also analyzed regional
variations in the change of mean atmospheric temperature since 1960 and
reported Bridgeport, CT, had warmed 2.6 ± 0.45ºC. |
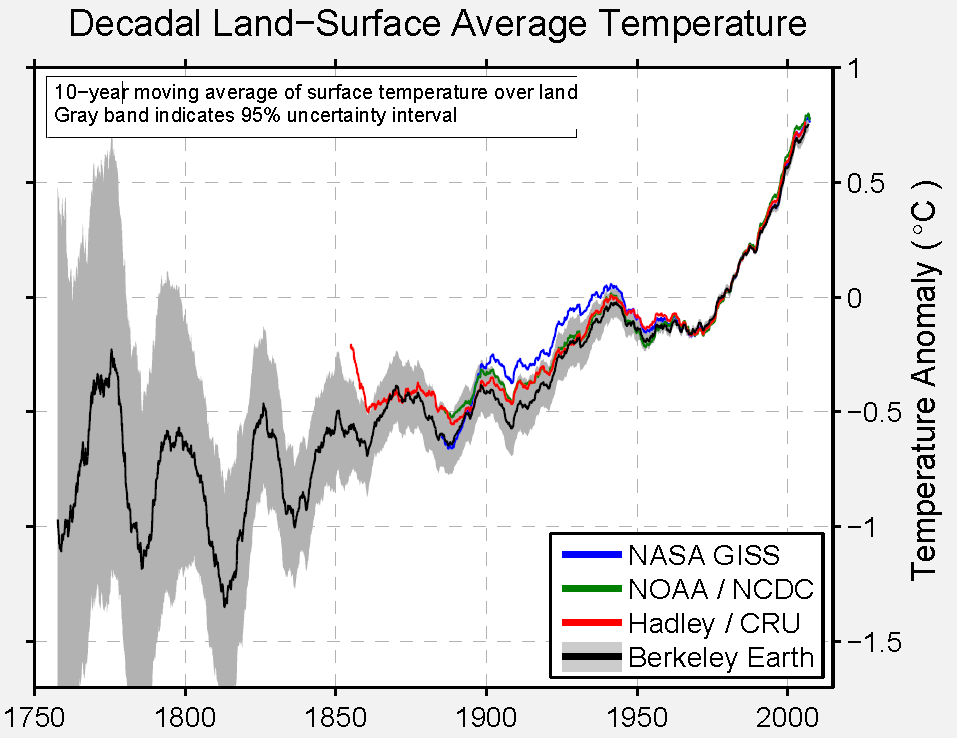 (from Rohde et al., 2011) (from Rohde et al., 2011)
|
The factors that made detecting
change in global average temperature difficult include:
- The magnitude of the change is small
compared to the variance due to sample location (latitude, longitude and
altitude).
- The magnitude of the change is small
compared to the variance at a site due to daily and annual cycles.
- There are long period (decadal)
oscillations in the records at many sites.
These challenges would be easily overcome
if the distribution of stations was uniform, the sample frequency resolved
daily variations, and the observation interval spanned many decades. However,
the data set was not perfect. Additional problems include:
- Sample locations are dense in some areas,
sparse in others, and altogether absent in Antarctica until 1950.
- Instrument design and performance, sampling
rates and times changed during the measurement interval.
- Few sample stations spanned the whole
period.
The detection of signatures of
climate change in observations from Long Island Sound has to overcome all
of these difficulties. In addition, the lack of sampling at a rate that
resolves the daily variations in water properties (temperature, salinity, etc.)
in the Sound prior to 2004 makes the trend detection even more difficult.
Though there is clearly a significant change in the global average air temperature
and this clearly influences many other processes in the environment,
characteristics of the variability in measurements and inadequacies in the
available data records may frustrate our ability to detect unambiguously the
changes. It is, therefore, likely that analyses of some types of data will
conclude that there is no detectable local climate change signal. Of course,
this does not mean that no link exists.
Since there are well established
large scale patterns of variation that have decadal-scale periods (e.g., El
Nino-Southern Oscillation and the North Atlantic Oscillation), a data record
from a limited geographic region that is shorter than four decades is unlikely
to yield a credible estimate of a trend unless the decadal-scale cycles can be
extracted. Therefore, analysis should be restricted to records that can be
aggregated to intervals longer than 40 years.
The Sentinel Monitoring Strategy identified
thirty-five sentinel characteristics of the ecosystem that were important and
identified an associated index that was measurable. However, few of these had
extensive data records and none has been shown to exhibit trends at the
global-scale. Most Sentinels were also linked to a subset of ten significant
ecological drivers:
- precipitation
- stream
flow
- sea
level
- air
temperature
- water
temperature
- salinity
- wind
(speed and direction)
- relative
humidity
- pH
- groundwater
levels
There are considerable data in the
Long Island Sound region for each of these quantities, much of which is
described in the Sentinel Monitoring Program data citation clearinghouse.
This
project focuses on collating and analyzing these ecological driver
variables
since the data records are longest and most likely to yield clear
results. We also address trends in three Sentinels (Lobster Habitat,
Marsh Flooding, and Sea Cliff Erosion) by exploring nonlinear
statistics such as the duration in excess of a
threshold (e.g. warmer that 20ºC or non-tidal water level anomalies
greater
than 1.4 m) and parametric estimates of significant wave height based
on wind
observations.
Our specific objectives were:
- To identify all available data for each of
the variables and aggregate series to synthesize records that are as long as
possible.
- To analyze data records of longer than 40
years to identify the long term variations and trends. We will then acquire
archived indices of global scale atmosphere-ocean cycles and employ correlation
analyses to establish what fraction of the long term variations in the ten
ecological drivers variables can be explained by the cycles and what can be
attributed to climate change.
- To analyze the river discharge, wind and
temperature records to establish the inter-annual variations in thresholds such
as the center of volume flow, frequency of winds from the northeast and
southwest in the summer, duration of temperature in excess of thresholds and
nonlinear statistics to be chosen after consultation with the LIS Science and
Technology Advisory Committee (STAC).
- To create a proxy record of significant
wave heights based on recent buoy observations and archived coastal wind
records.
- To disseminate the raw data, the time
series resulting from our analyses, and the programs used to create them
through a project website.
- To provide advice to the LIS Program on
future monitoring and analyses that are necessary to better link our products
to the Sentinels.
References
Hansen,
J., R. Ruedy, J. Glascoe, and M. Sato (1999). GISS analysis
of surface temperature change, J. Geophys. Res.,
104(D24), 30,997–31,022, doi:10.1029/1999JD900835.
Jones,
P.D., M. New, D.E. Parker, S. Martin and Rigor, I.G. (1999). Surface air
temperature and its variations over the last 150 years. Reviews of
Geophysics 37, 173-199.
Reynolds,
Richard W. and Thomas M. Smith (1994). Improved Global Sea Surface Temperature
Analyses Using Optimum Interpolation. J. Climate, 7, 929–948. doi:
10.1175/1520-0442(1994)007.
Rohde,
R., R.A. Muller, R. Jacobsen, E. Muller, S. Perlmutter, A. Rosenfeld, J. Wurtele,
D. Groom and C. Wickham (2011). A New
Estimate of the Average Earth Surface Land Temperature Spanning 1753 to 2011.
J. Geophys. Res. (submitted).
Back to top
|